
The Road That Came With Proof
Abstract
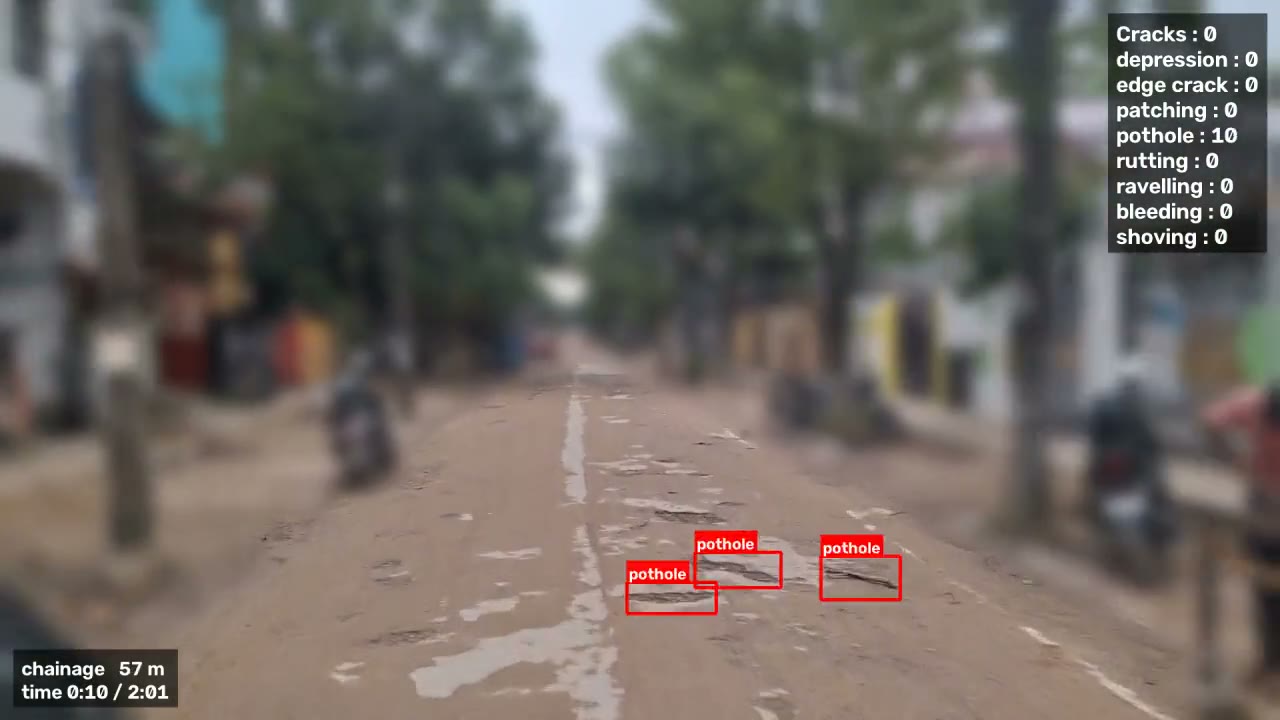
Road agencies increasingly collect survey video, and it is tempting to hand that video straight to a multimodal language model and ask for a maintenance plan. We test whether the form of the evidence matters. From one 121-second survey drive over a 682 m urban road, we built two inputs: one frame per second with its GPS chainage (FOOTAGE), and the 138 defect detections a tracking detector had already written to a structured log (LOG). We asked Qwen3.5-27B for work orders under IRC:82-2015 five times per input, and checked every detection in the log by hand. The LOG runs ordered 122 to 128 potholes against a hand count of 110, while the FOOTAGE runs ordered between 0 and 100. 34 of the 35 LOG orders were confined to a specific stretch of road, while all 16 FOOTAGE orders spanned the whole road. Every LOG order cites detection rows that can be opened and inspected, and the LOG input used 34% of the FOOTAGE input tokens. Detector errors do reach the orders, but each one traces back to a single row. The study covers one road and one model, so we present it as a first result rather than a benchmark.
Keywords: road condition survey, pavement maintenance, large language models, evidence provenance, object detection, IRC:82-2015
1Introduction
The product of a road condition survey is a set of maintenance decisions: what to repair, where, and in what quantity. In India these decisions follow the Indian Roads Congress code of practice for bituminous roads, IRC:82-2015 [1]. Survey video is cheap to collect, and a capable multimodal model can describe what it sees, so one obvious design is to give the model the video and ask it for work orders.
The alternative is to place a detector in between. The detector turns the video into a log of discrete, located observations, and the language model reasons over that log instead of over pixels. This adds a component, and the detector’s errors become part of the input. It also gives every conclusion a row it can point to.
We compare the two designs on the same drive, with the same model and the same instructions. Our questions are practical ones a road engineer would ask of a work order: is the quantity stable across runs, is the work located on the road, and can each order be checked against its evidence?
This report makes three contributions:
- A paired comparison of video frames and a structured detection log as input to the same language model, on the same survey, over five seeds each.
- A complete hand check of all 138 detections in the log, which gives a ground count against which work order quantities can be judged.
- A trace from individual work orders back to the detections they cite, including the cases where the detector was wrong.
2Data and detector
2.1Survey
The survey is a single phone video of an urban road in India, recorded on 3 September 2026. It runs 121 s at 1920×1080 and 30 fps, with a GPX track that places it along 682 m of chainage.
2.2The detection log
The detector is road_defects v1, a YOLOv8 model [2] with object tracking, run through ONNX Runtime [3] with the production code of phyOS. Tracking matters here: a pothole that stays in view for two seconds is recorded once rather than sixty times. For each tracked defect the detector writes one row containing its class, the model’s confidence, the frame, the bounding box, and the GPS chainage at which it was seen.
On this drive it wrote 138 rows. We regenerated the log for this study with the production code. For the first 25 seconds, where production had already written 38 rows, the regenerated log matches all 38 exactly, on both CPU and GPU.
3Method
3.1Inputs
Both inputs derive from the same drive. FOOTAGE is one frame per second, downscaled to 960×540, with each frame stamped with its frame number, time, and chainage; it comes to 75,617 input tokens. LOG is the 138 detection rows rendered as text; it comes to 25,981 input tokens.
3.2Model and decoding
We used Qwen3.5-27B [4] with FP8 weights, served by vLLM 0.31.0 [5] on one NVIDIA A100 40 GB. Decoding used temperature 0.6, top-p 0.95 and top-k 20, with seeds 1 to 5 for each input, and output was constrained to a JSON schema. All ten answers conformed to the schema and finished before the token limit.
3.3Instructions
The instructions were identical for both inputs. They set out the IRC:82-2015 maintenance criteria and a fixed work order schema in which each order names a treatment, a chainage range, a quantity, and the evidence it rests on. The prompt allowed an order either to cite every supporting item or to cite only the first and last item in its range.
3.4Hand verification
One reviewer opened the frame behind each of the 138 detections and labelled it as a real defect, not a defect, or cannot tell. This gives a precision figure for the detector and a hand count of real potholes. It does not measure recall: defects the detector missed are not counted.
3.5Measures
For each run we record the number of orders, the order types, the pothole quantity ordered, and the evidence cited. For each order we compute its coverage, the share of the road it spans:
coverage = (chainageend − chainagestart) / 682 m
We call an order with coverage of 0.9 or more a whole-road order. Area and length quantities are reported but not compared, because neither input carries a ground scale (section 4.5).
4Results
4.1Quality of the log
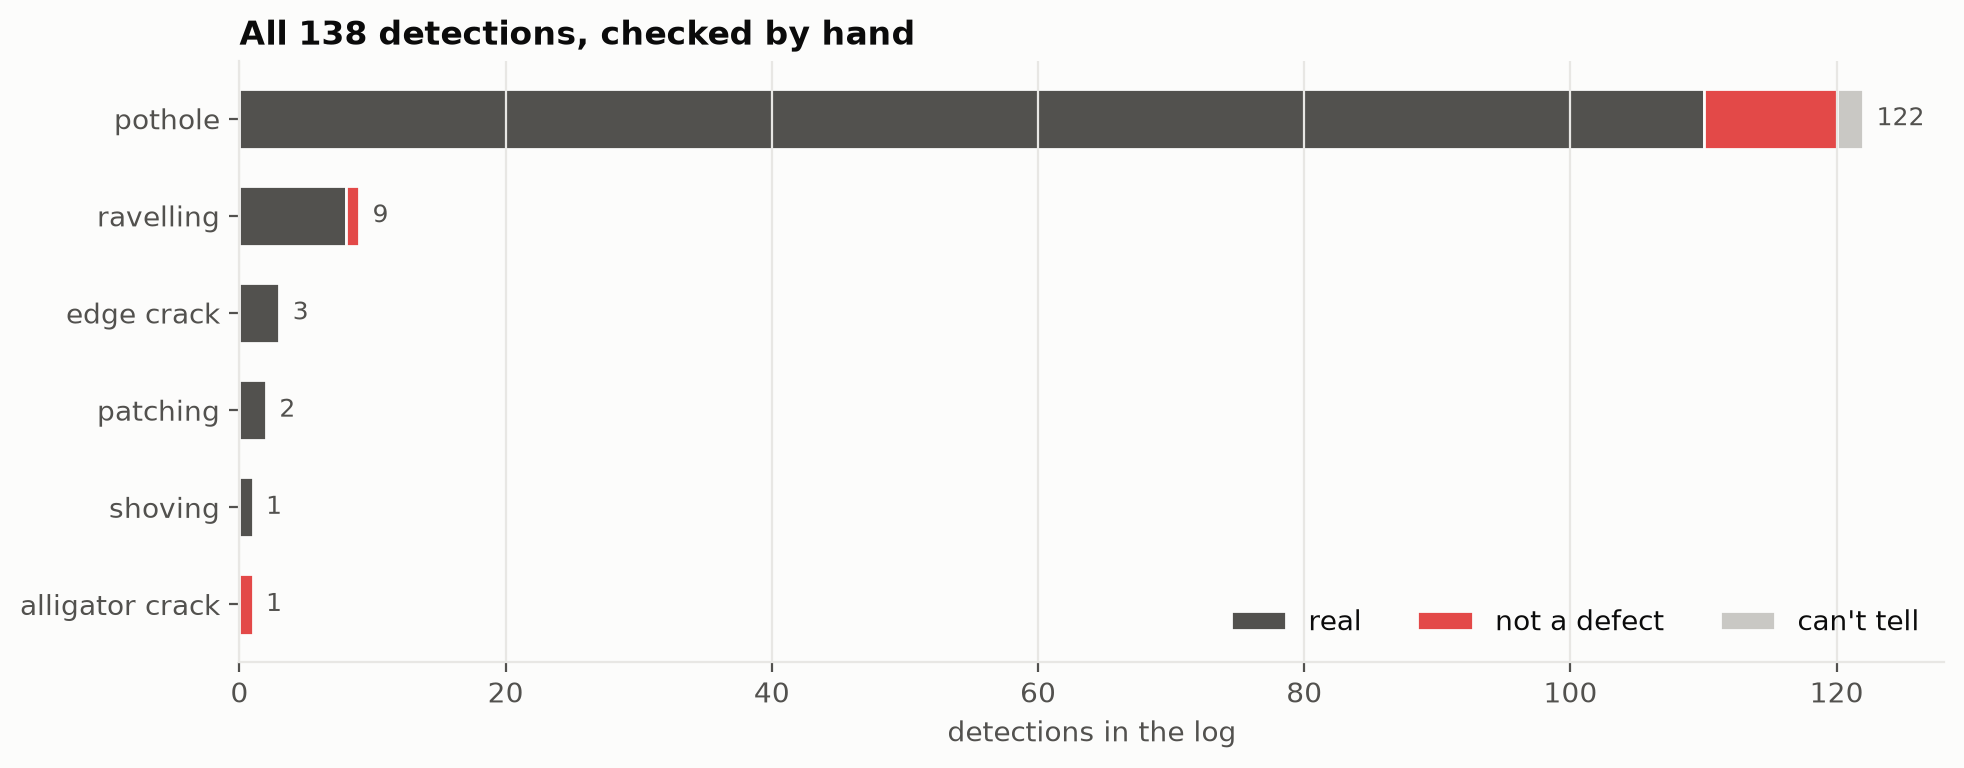
Of the 136 detections that could be judged, 124 are real defects. For potholes, the class that drives most of the work, 110 of 122 are real, 10 are not a defect and 2 could not be judged. That is a precision of 92% among those judged, with a 95% interval of 85% to 95% (Table 1).
Table 1. Hand check of all 138 detections, by class.
| Class | Detections | Real | Not a defect | Cannot tell |
|---|---|---|---|---|
| pothole | 122 | 110 | 10 | 2 |
| ravelling | 9 | 8 | 1 | 0 |
| edge crack | 3 | 3 | 0 | 0 |
| patching | 2 | 2 | 0 | 0 |
| shoving | 1 | 1 | 0 | 0 |
| alligator crack | 1 | 0 | 1 | 0 |
log #135 · 0.67 · 641 m
log #128 · 0.64 · 452 m
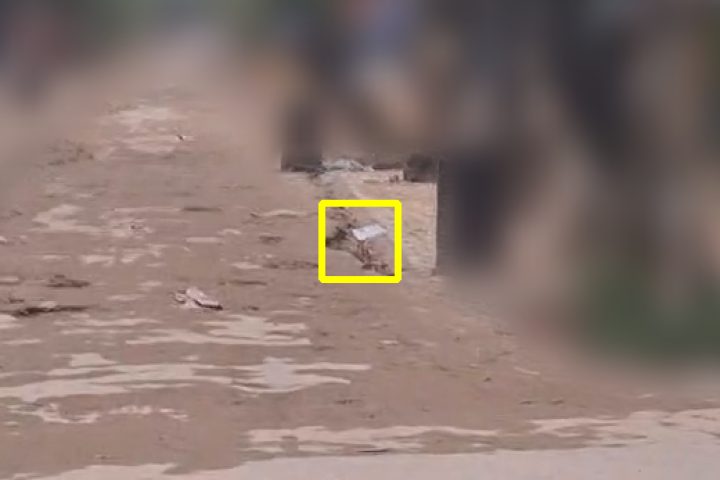
log #42 · 0.62 · 139 m
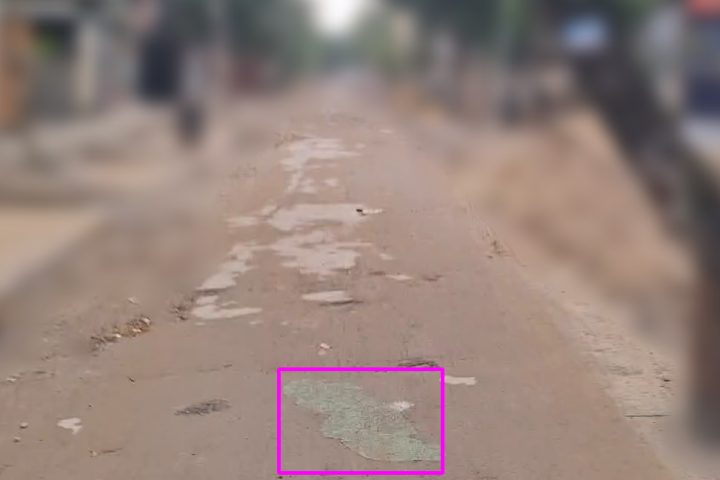
log #50 · 0.52 · 159 m
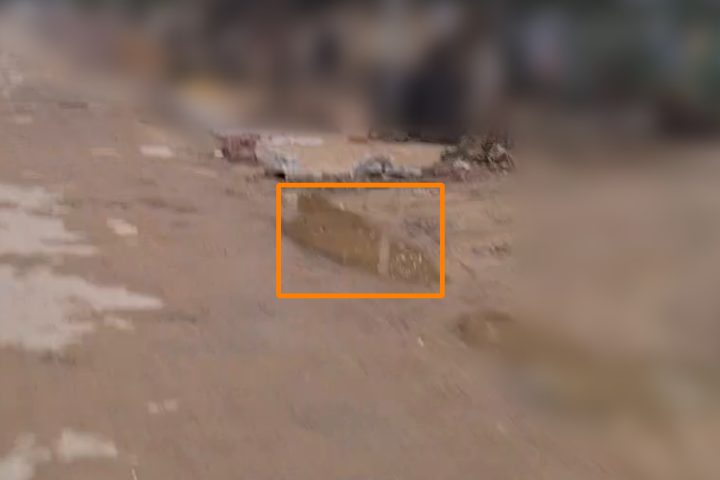
log #58 · 0.53 · 172 m
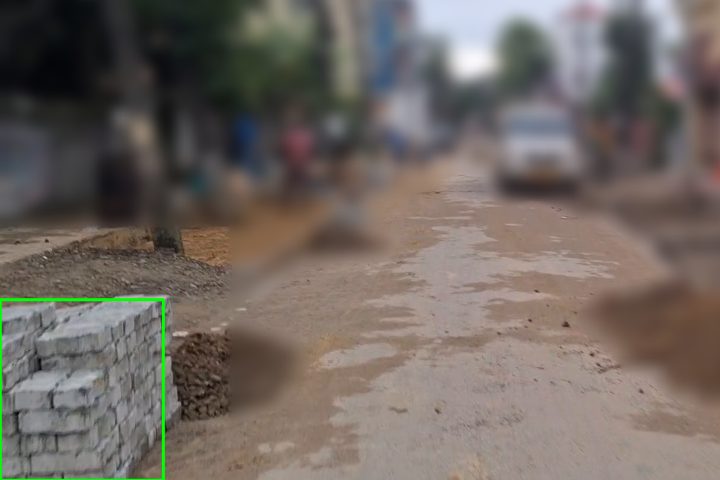
log #73 · 0.60 · 262 m
4.2Spatial placement of orders
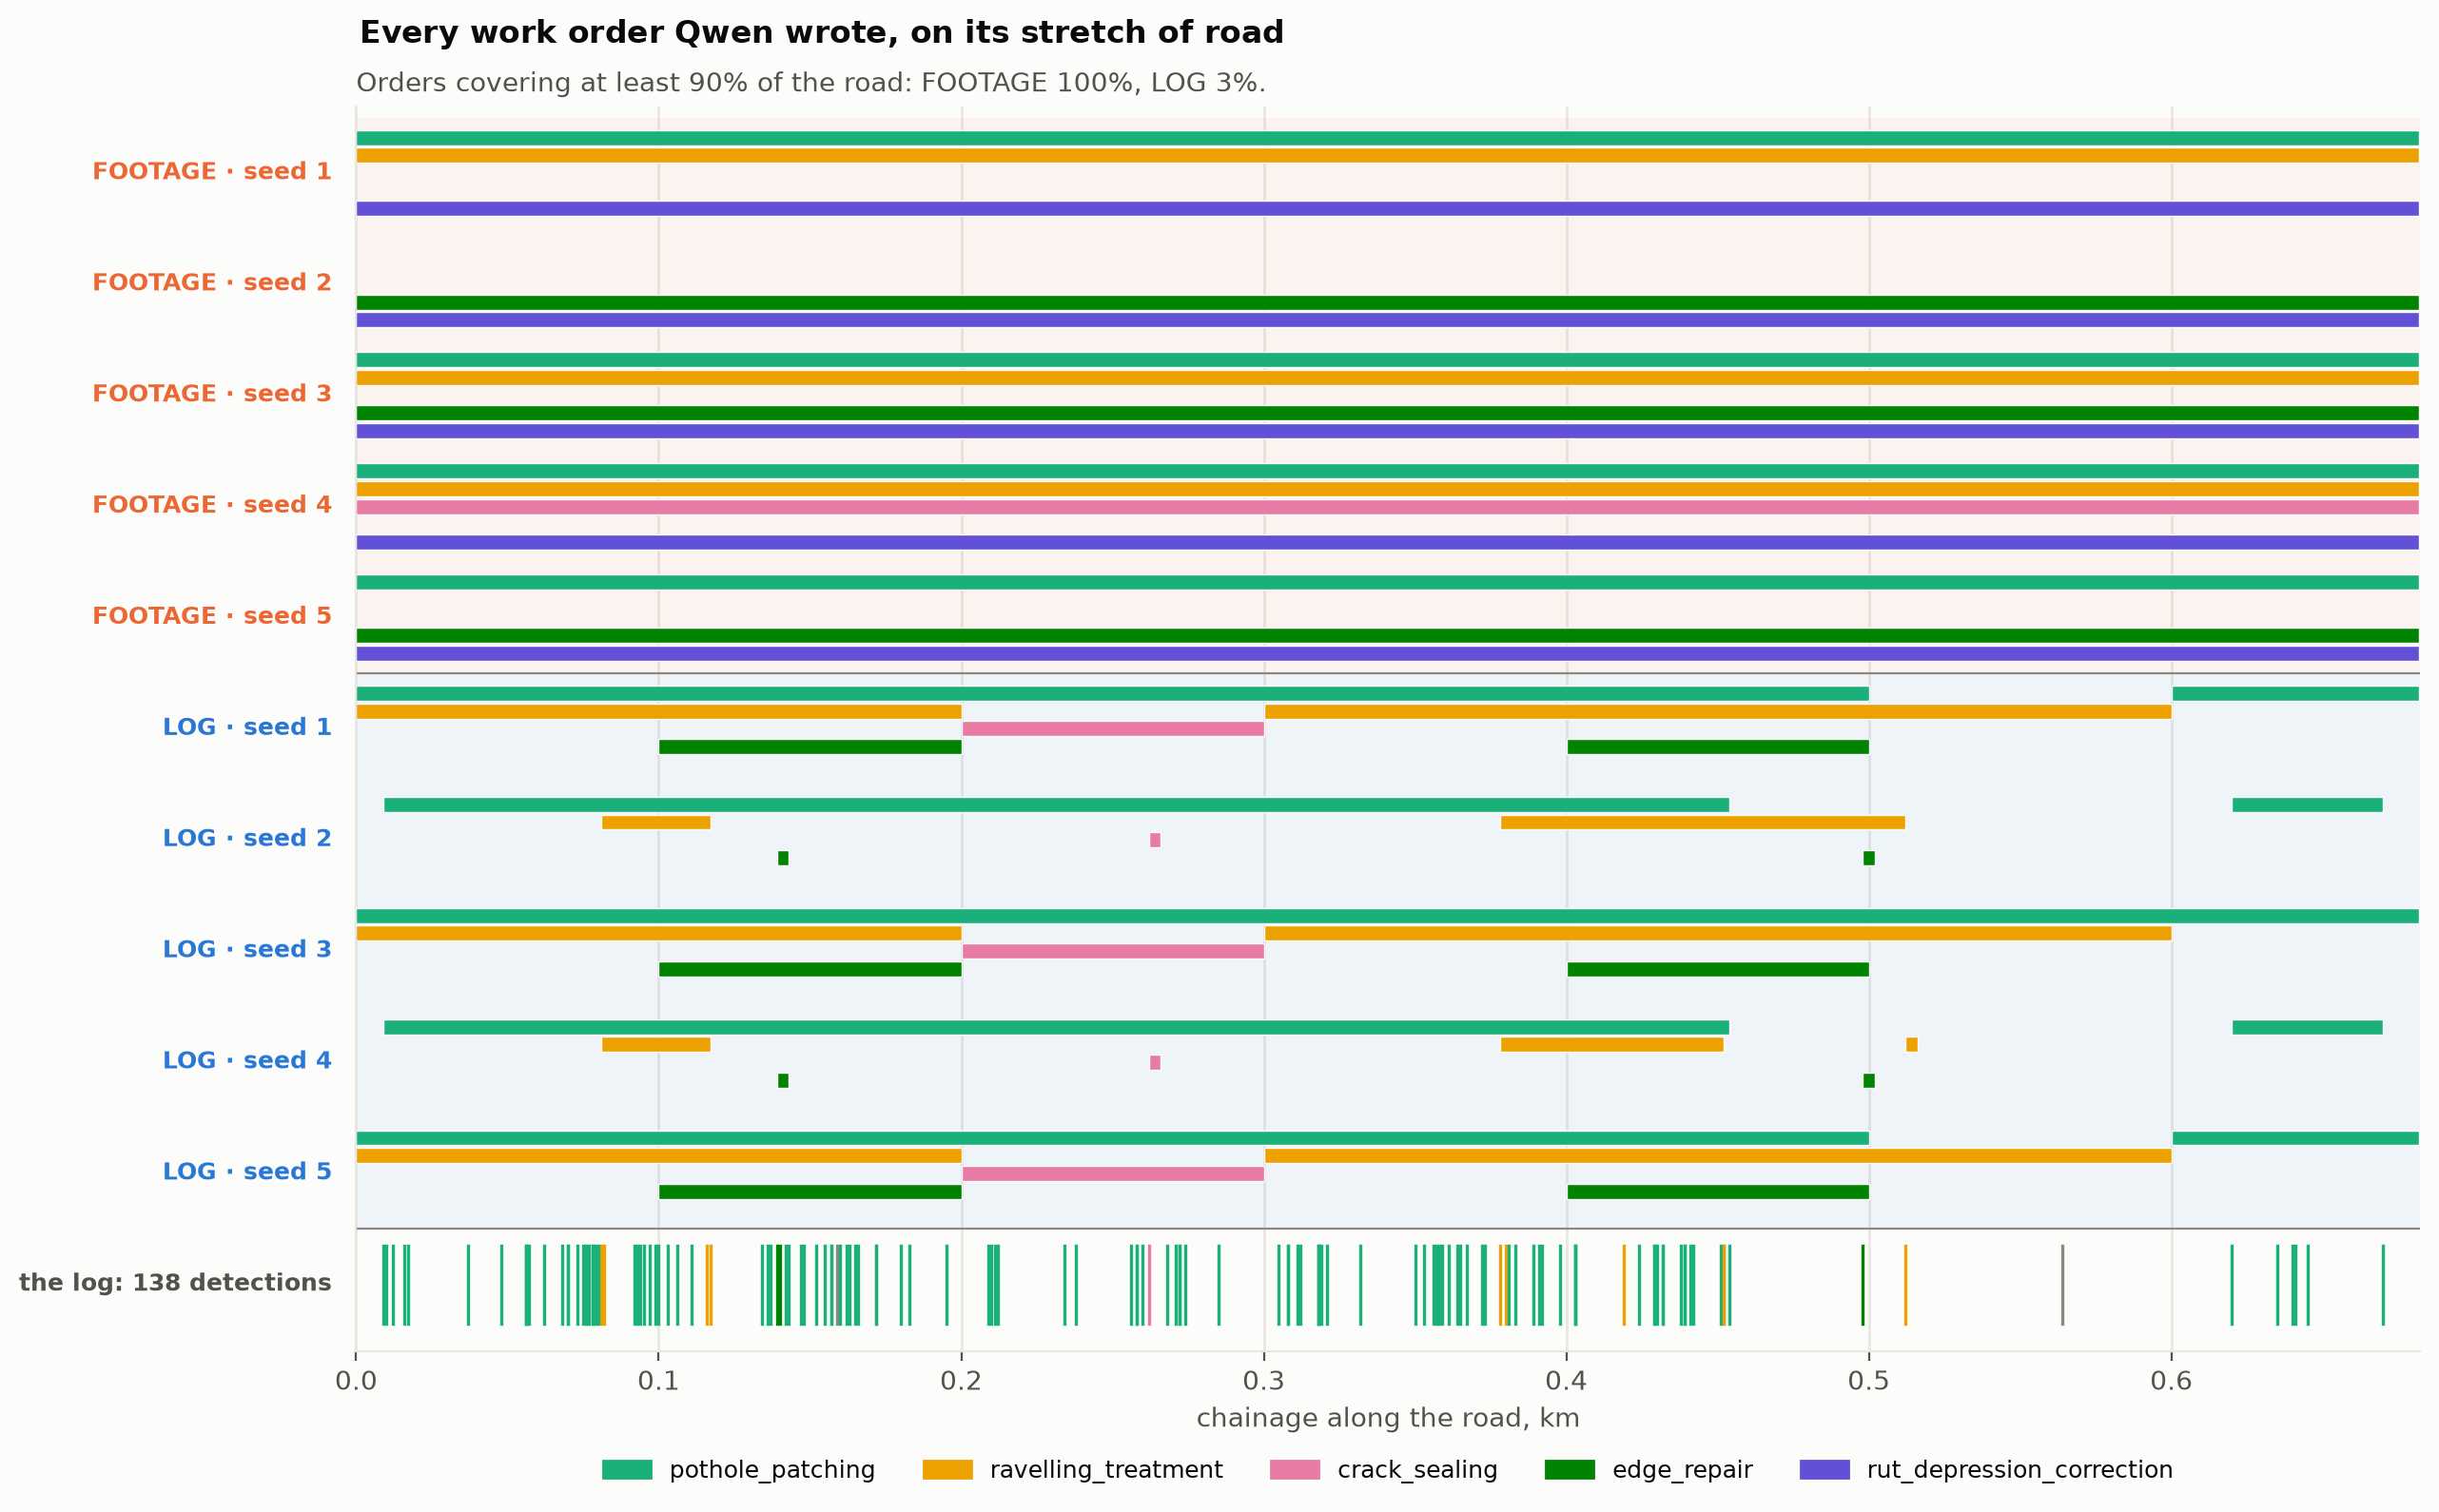
The clearest difference between the inputs is where the work is placed (Figure 4). All 16 FOOTAGE orders run from 0 to 682 m, so every one of them is a whole-road order. Only 1 of the 35 LOG orders is; the other 34 cover part of the road.
The LOG runs also leave out stretches where nothing was detected. In 4 of the 5 runs, pothole patching stops between 454 and 500 m and resumes at 600 to 620 m, which is exactly the stretch where the log holds no pothole detections. The orders follow the evidence rather than covering the road by default.
4.3Pothole quantities
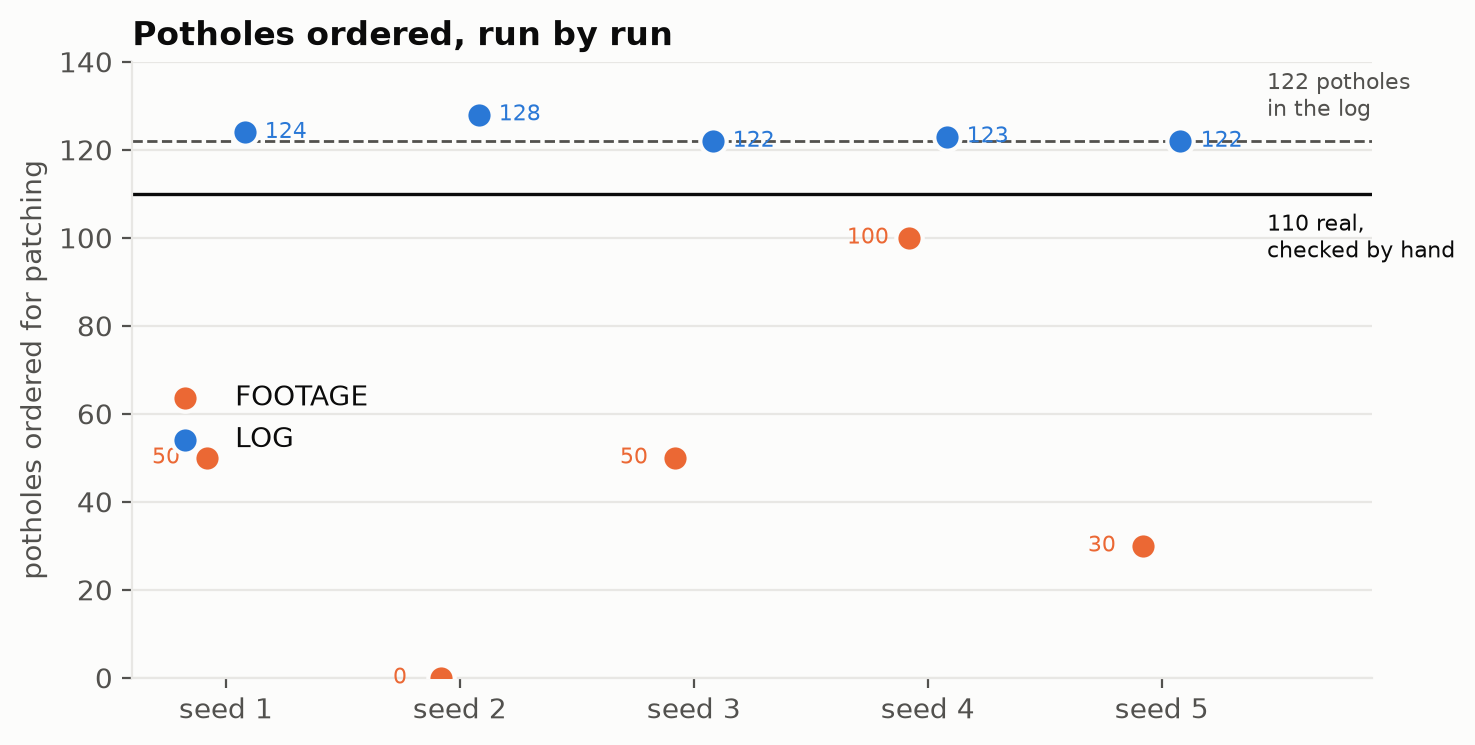
Table 2 summarises the runs. The LOG runs ordered 122 to 128 potholes (mean 123.8, standard deviation 2.5). That tracks the 122 pothole rows in the log, which include the 10 false detections and the 2 that could not be judged, so the LOG runs over-order by roughly that margin relative to the hand count of 110. The FOOTAGE runs ordered 50, 0, 50, 100 and 30 (mean 46, standard deviation 36.5), and seed 2 ordered no pothole patching at all (Figure 5).
Table 2. Summary of the ten runs, five per input.
| Measure | FOOTAGE | LOG |
|---|---|---|
| Work orders, five runs | 16 | 35 |
| Whole-road orders (coverage ≥ 0.9) | 16 | 1 |
| Potholes ordered, seeds 1 to 5 (hand count 110) | 50, 0, 50, 100, 30 | 124, 128, 122, 123, 122 |
| Evidence cited per pothole order | 1 to 5 frames | 2 to 116 detections |
| Order types per run | 2 to 4 | 4 in every run |
| Rut correction ordered | 5 of 5 runs | 0 of 5 runs |
| Input tokens per run | 75,617 | 25,981 |
4.4Order types
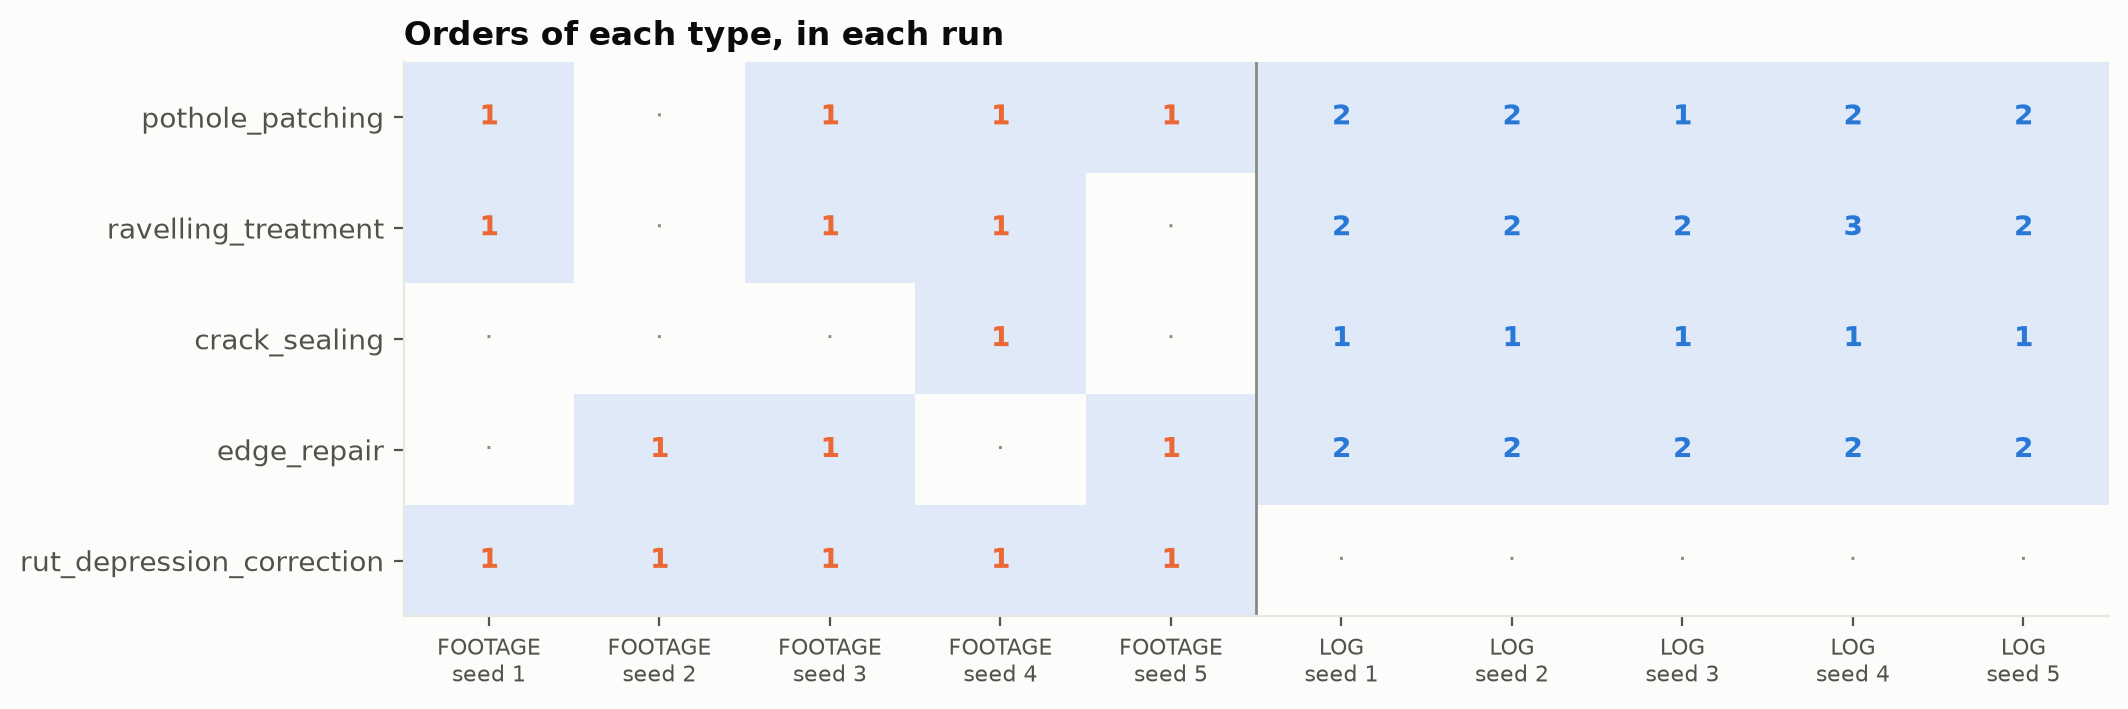
Every LOG run ordered the same four treatments: pothole patching, ravelling treatment, edge repair and crack sealing. The FOOTAGE runs ordered between two and four types (Figure 6).
One result runs the other way. All five FOOTAGE runs ordered rut correction and no LOG run did. The detector has a rutting class but recorded no ruts on this road, so the LOG input could not support such an order. We have not yet verified whether ruts are present, so we cannot say which input is right on this point.
4.5Quantities
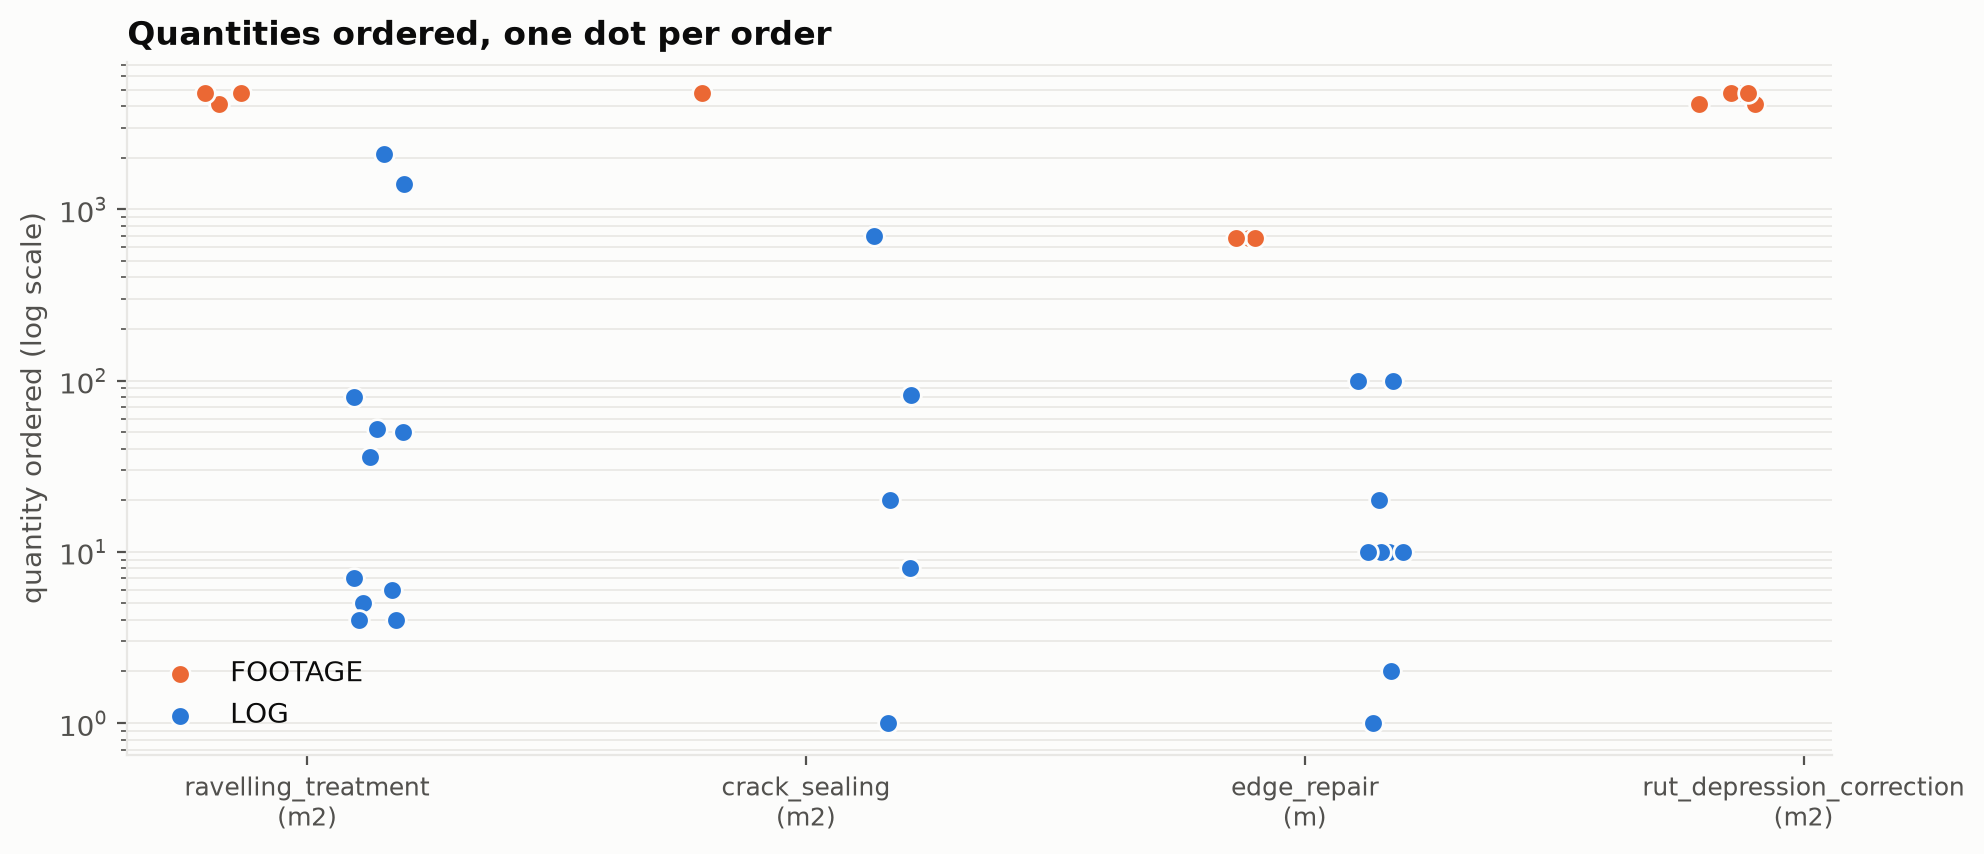
Neither input carries a ground scale, so every area and length in the orders is the model’s own estimate (Figure 7). The FOOTAGE area orders cover the whole carriageway, at 4,092, 4,100 and 4,774 m². For this reason we compare pothole counts only.
4.6Tracing an order to its evidence
Figure 8 places the first pothole patching order from seed 1 of each input side by side. The LOG order cites 116 detections, of which the hand check found 105 real, and any one of them can be opened to see the pothole. The FOOTAGE order cites three frames, and the quantity it gives rests on the model’s reading of the rest of the video. In seeds 1 and 2 the LOG orders cite every detection in their range; in seeds 3 to 5 they cite only the first and last, as the prompt allowed.
LOG seed 1, order 1
- Stretch
- 0 to 500 m
- Quantity
- 118 potholes
- Evidence
- 116 detections, 105 real by hand check; every tenth shown
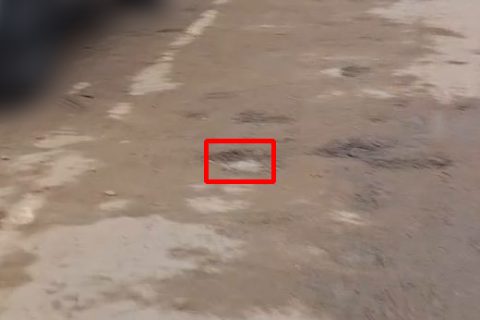
log #1 · 0.59 · 9 m
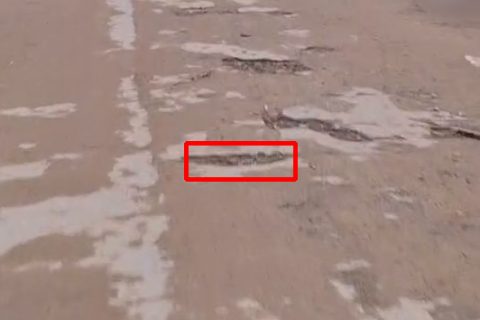
log #10 · 0.50 · 56 m
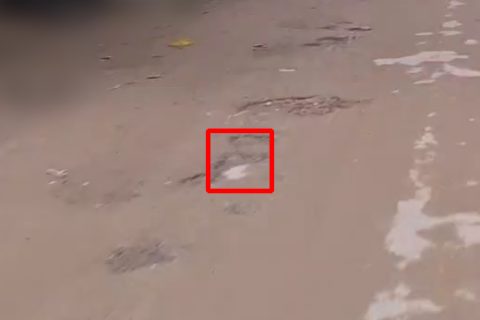
log #19 · 0.54 · 76 m
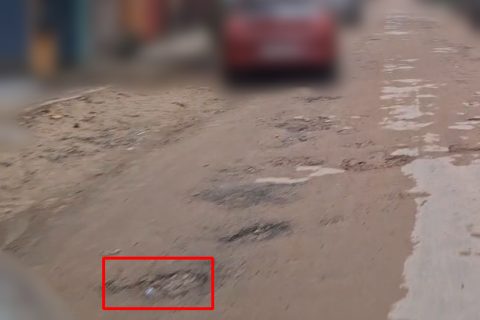
log #30 · 0.54 · 95 m
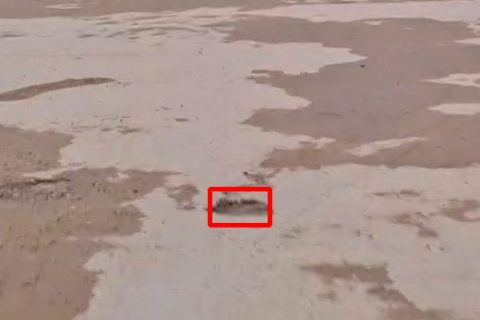
log #41 · 0.55 · 137 m
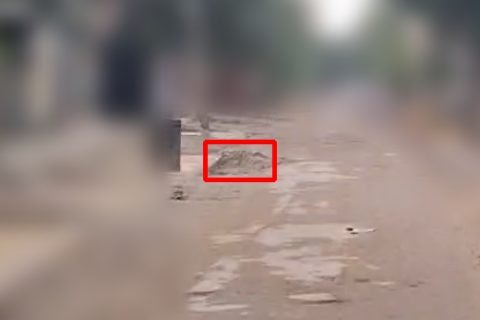
log #53 · 0.57 · 157 m
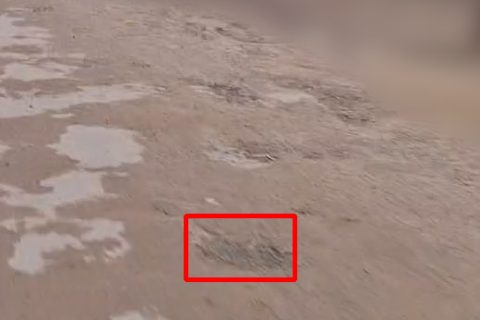
log #63 · 0.64 · 209 m
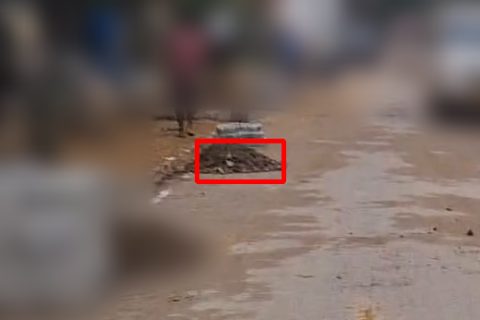
log #72 · 0.57 · 258 m
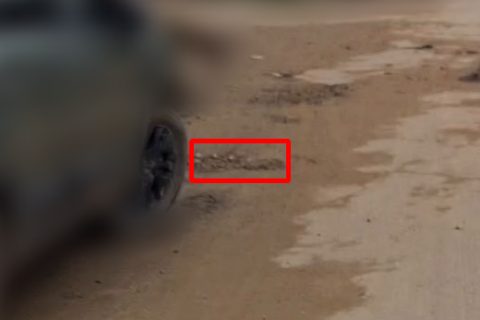
log #82 · 0.52 · 308 m
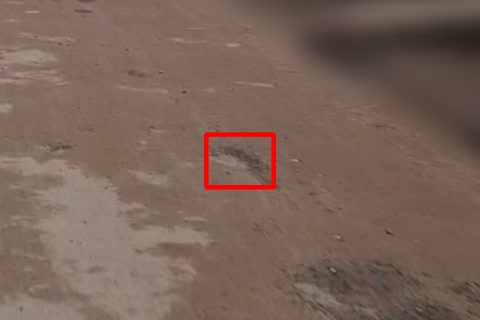
log #91 · 0.54 · 350 m
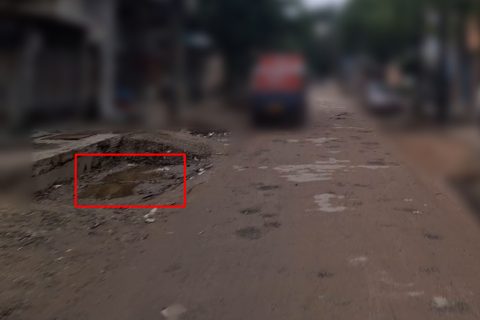
log #100 · 0.54 · 367 m
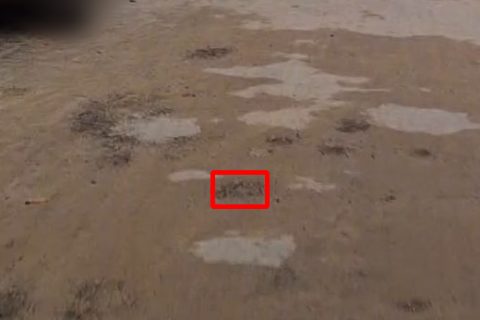
log #111 · 0.60 · 403 m
FOOTAGE seed 1, order 1
- Stretch
- 0 to 682 m
- Quantity
- 50 potholes
- Evidence
- 3 frames, all shown
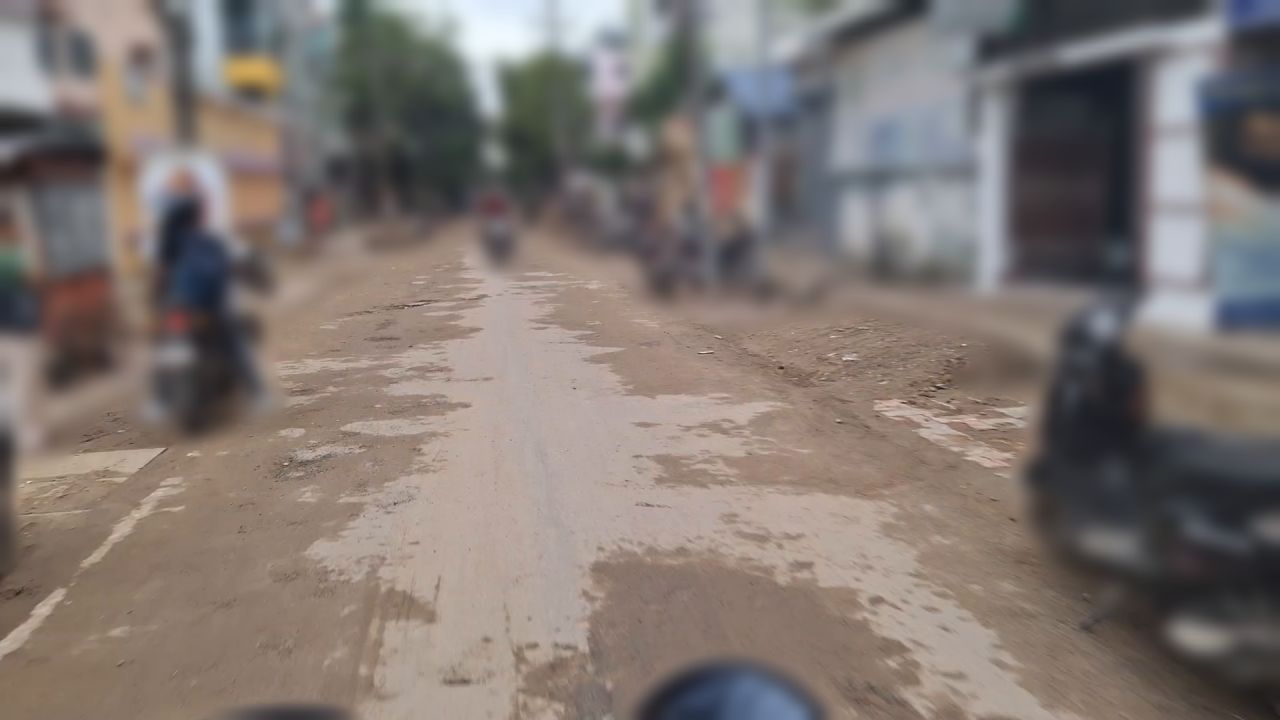
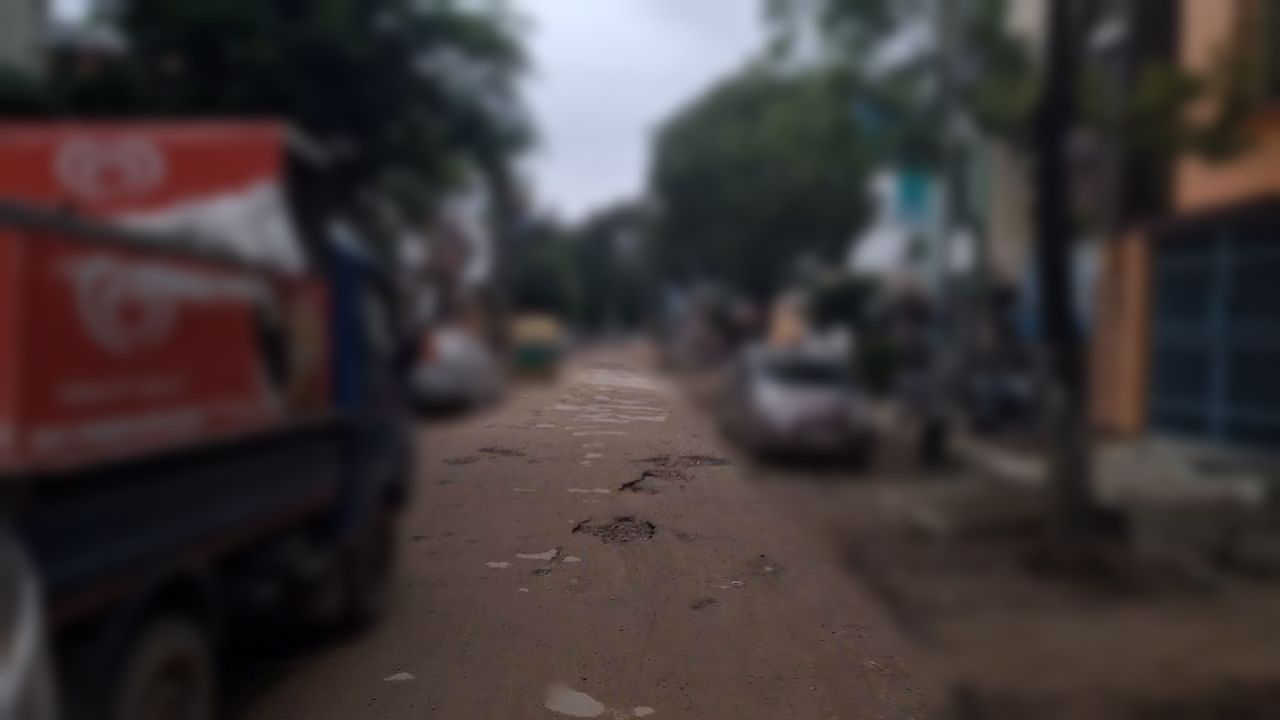
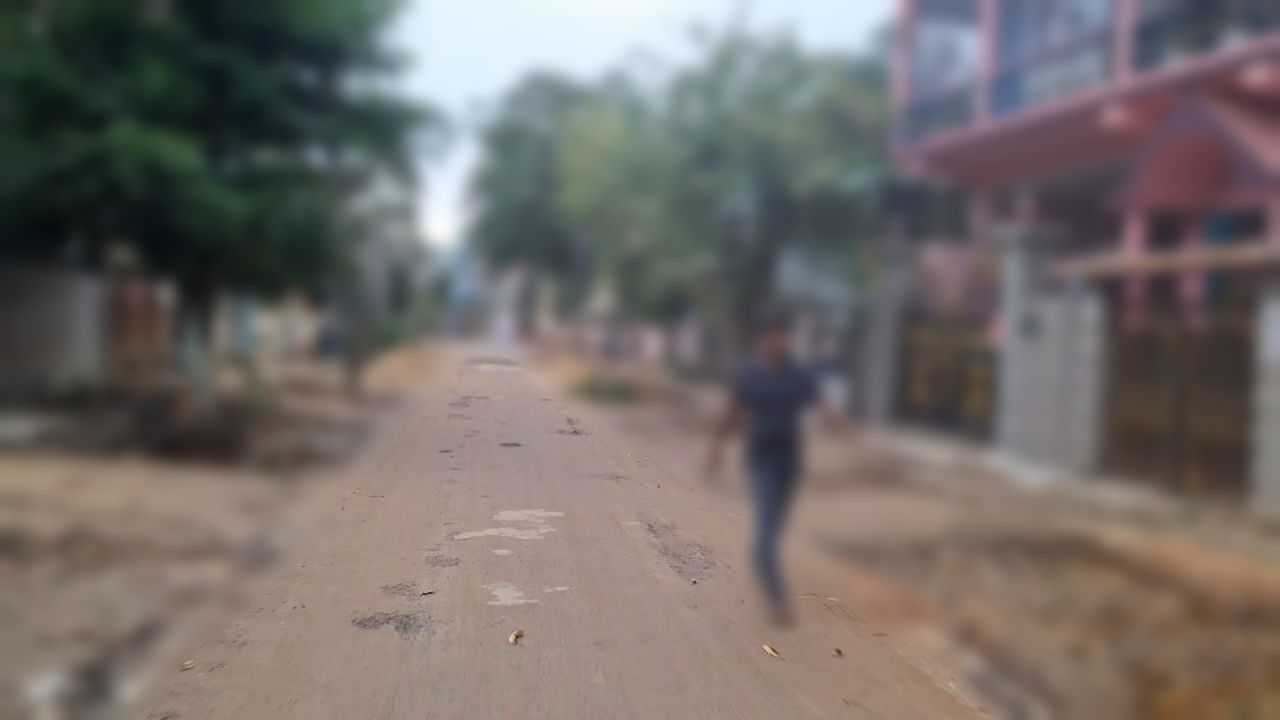
4.7Propagation of detector errors
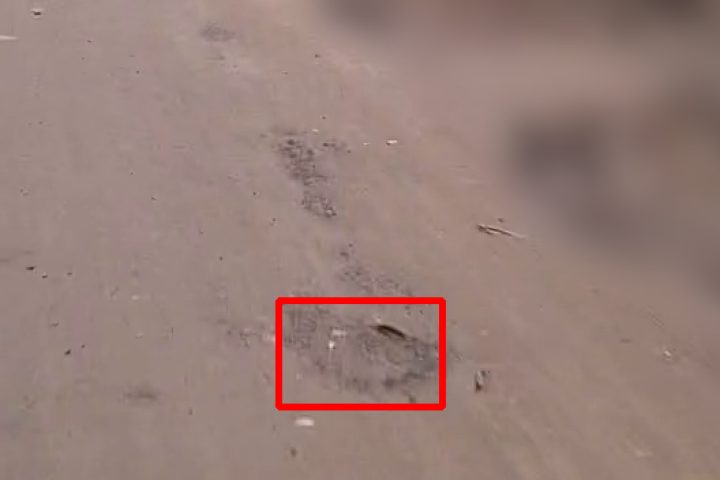
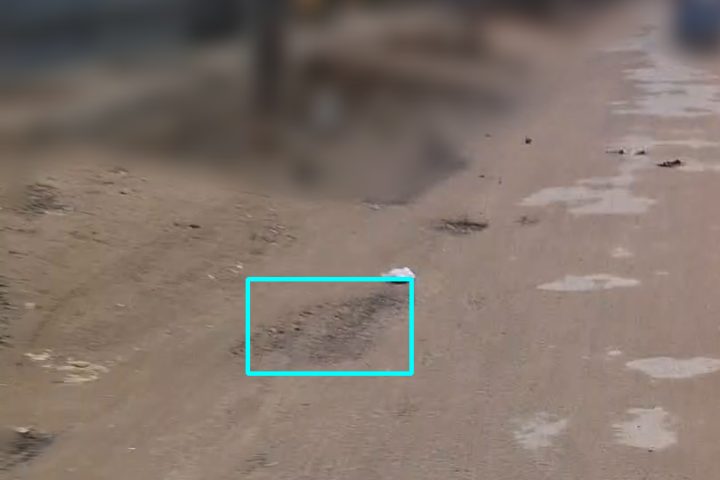
The LOG runs inherit the detector’s mistakes. The clearest case is the stack of paver blocks recorded as an alligator crack (log row 73, at 262 m): all five LOG runs ordered crack sealing at that location. The error is real, but it is confined to one row, at one chainage, with one frame behind it, so a reviewer can find and remove it in seconds. Figure 9 shows three of the ten detections the reviewer marked as not a pothole.
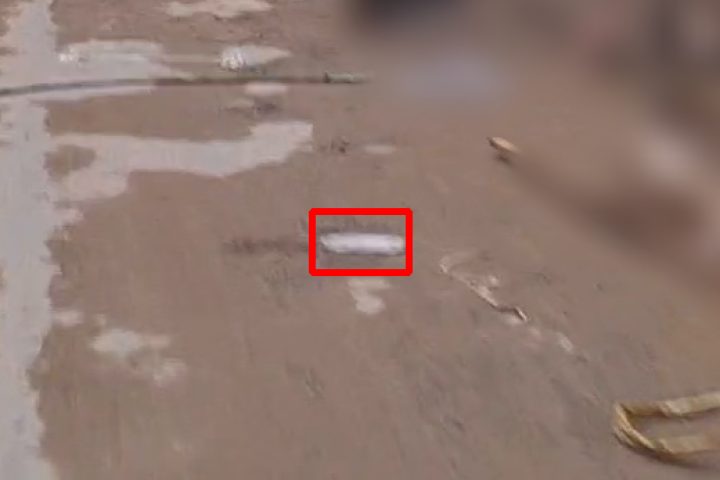
log #7 · 0.74 · 48 m
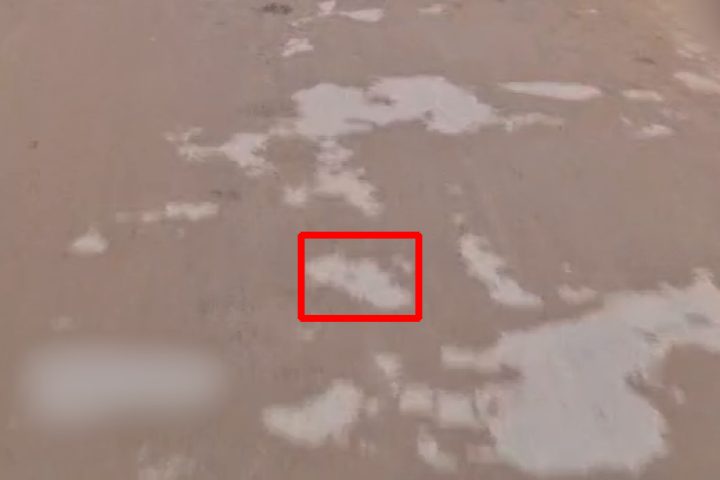
log #62 · 0.67 · 195 m
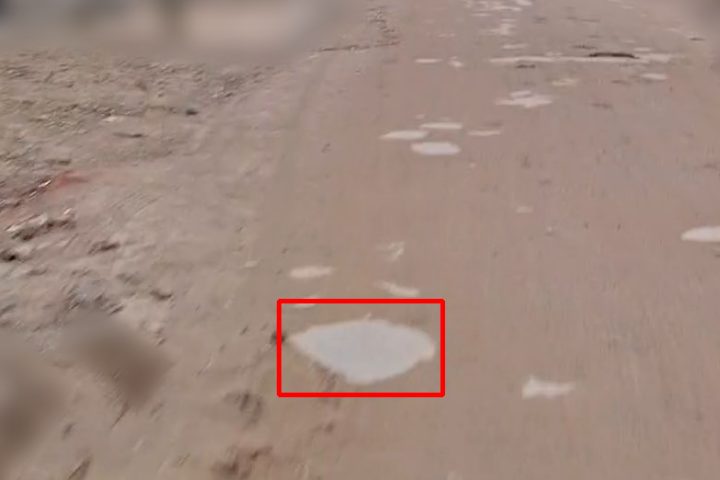
log #60 · 0.60 · 180 m
5Discussion
Given frames, the model behaved like a reader skimming a video. It produced few orders, spread each one across the whole road, and gave pothole counts that varied by a factor of two or more between seeds, including one run with none. Given the log, it behaved more like an engineer working from a defect register. Its counts were stable, its orders were located, and each one listed the rows behind it.
The two inputs fail in different ways. The log carries the detector’s false positives into the orders, which is why the LOG runs over-order potholes by about ten percent. Those errors are visible and individually correctable. The FOOTAGE runs have no such handle: when an order says 50 potholes over the whole road, there is no row to check and no stretch to inspect, only three frames and the model’s word.
Cost points the same way on this road. The log is about a third of the input, and that ratio would likely widen on longer drives, since the frame count grows with duration while the log grows with the number of defects. We have not measured this.
The rut correction result is a reminder that a log can only report what its detector was built to see and actually saw. A defect the detector misses never reaches the language model, whereas the raw frames at least contain it. Pairing the log with targeted frame review for classes the detector rarely fires on is a natural next step.
6Limitations
- The study covers one road, one language model and five runs per input. It is a first result, not a benchmark.
- A single reviewer performed the hand check, and it measures precision only. Potholes the detector missed are not counted, so the hand count of 110 is a lower bound on the true number.
- Nine other roads were also run. Most are unpaved and fall outside the scope of IRC:82-2015, which covers bituminous roads, so they are not reported here.
- The model ran with FP8 weights and an FP8 key-value cache without calibrated scales, which may affect output quality.
- The presence or absence of ruts on this road has not been verified.
7Conclusion
On this road, giving the language model a structured detection log instead of raw video produced work orders that were more consistent in quantity, placed on specific stretches of road, and traceable to individual pieces of evidence, at about a third of the input cost. The log’s errors passed into the orders, but each could be located and corrected. This is the premise behind phyOS: field methods such as road_defects turn video into rows with a place, a time and a source, so that whatever reasons over those rows, a person or a model, can be held to account for each conclusion it draws. The next steps are more roads, a second reviewer, a recall estimate for the detector, and a check of the rut question.
References
- Indian Roads Congress. IRC:82-2015, Code of Practice for Maintenance of Bituminous Road Surfaces (first revision). New Delhi, 2015.
- G. Jocher, A. Chaurasia and J. Qiu. Ultralytics YOLOv8. Software, 2023. github.com/ultralytics/ultralytics
- ONNX Runtime developers. ONNX Runtime. Software. onnxruntime.ai
- Qwen Team. Qwen3.5-27B. Model release. huggingface.co/Qwen
- W. Kwon, Z. Li, S. Zhuang, Y. Sheng, L. Zheng, C. H. Yu, J. E. Gonzalez, H. Zhang and I. Stoica. Efficient memory management for large language model serving with PagedAttention. In Proceedings of the 29th ACM Symposium on Operating Systems Principles, 2023.
Appendix A. Experimental setup at a glance
- Survey
- Phone video, 121 s, 1920×1080 at 30 fps, with GPX track; 682 m of chainage; recorded 3 September 2026.
- Detector
- phyOS road_defects v1 (YOLOv8 with tracking), production code, ONNX Runtime.
- Language model
- Qwen3.5-27B, FP8 weights, vLLM 0.31.0, one A100 40 GB.
- Decoding
- Temperature 0.6, top-p 0.95, top-k 20; seeds 1 to 5; JSON schema output.
- FOOTAGE input
- 1 frame/s at 960×540, stamped with frame number, time and chainage; 75,617 tokens.
- LOG input
- 138 detection rows as text; 25,981 tokens.
- Instructions
- Identical for both inputs: IRC:82-2015 criteria and a fixed work order schema.
- Hand check
- All 138 detections, one reviewer, 2 November 2026.
phyOS by Cognecto. Frames and video are blurred outside the road surface.